In Infino Legal, you can utilize one of the most effective methods for managing tasks in the workplace. Kanban Board is a simple tool that allows you to customize task management according to the needs of your office. In Infino Legal, you can add your own columns and their order, set task priorities, and also access charts and reports on office productivity.
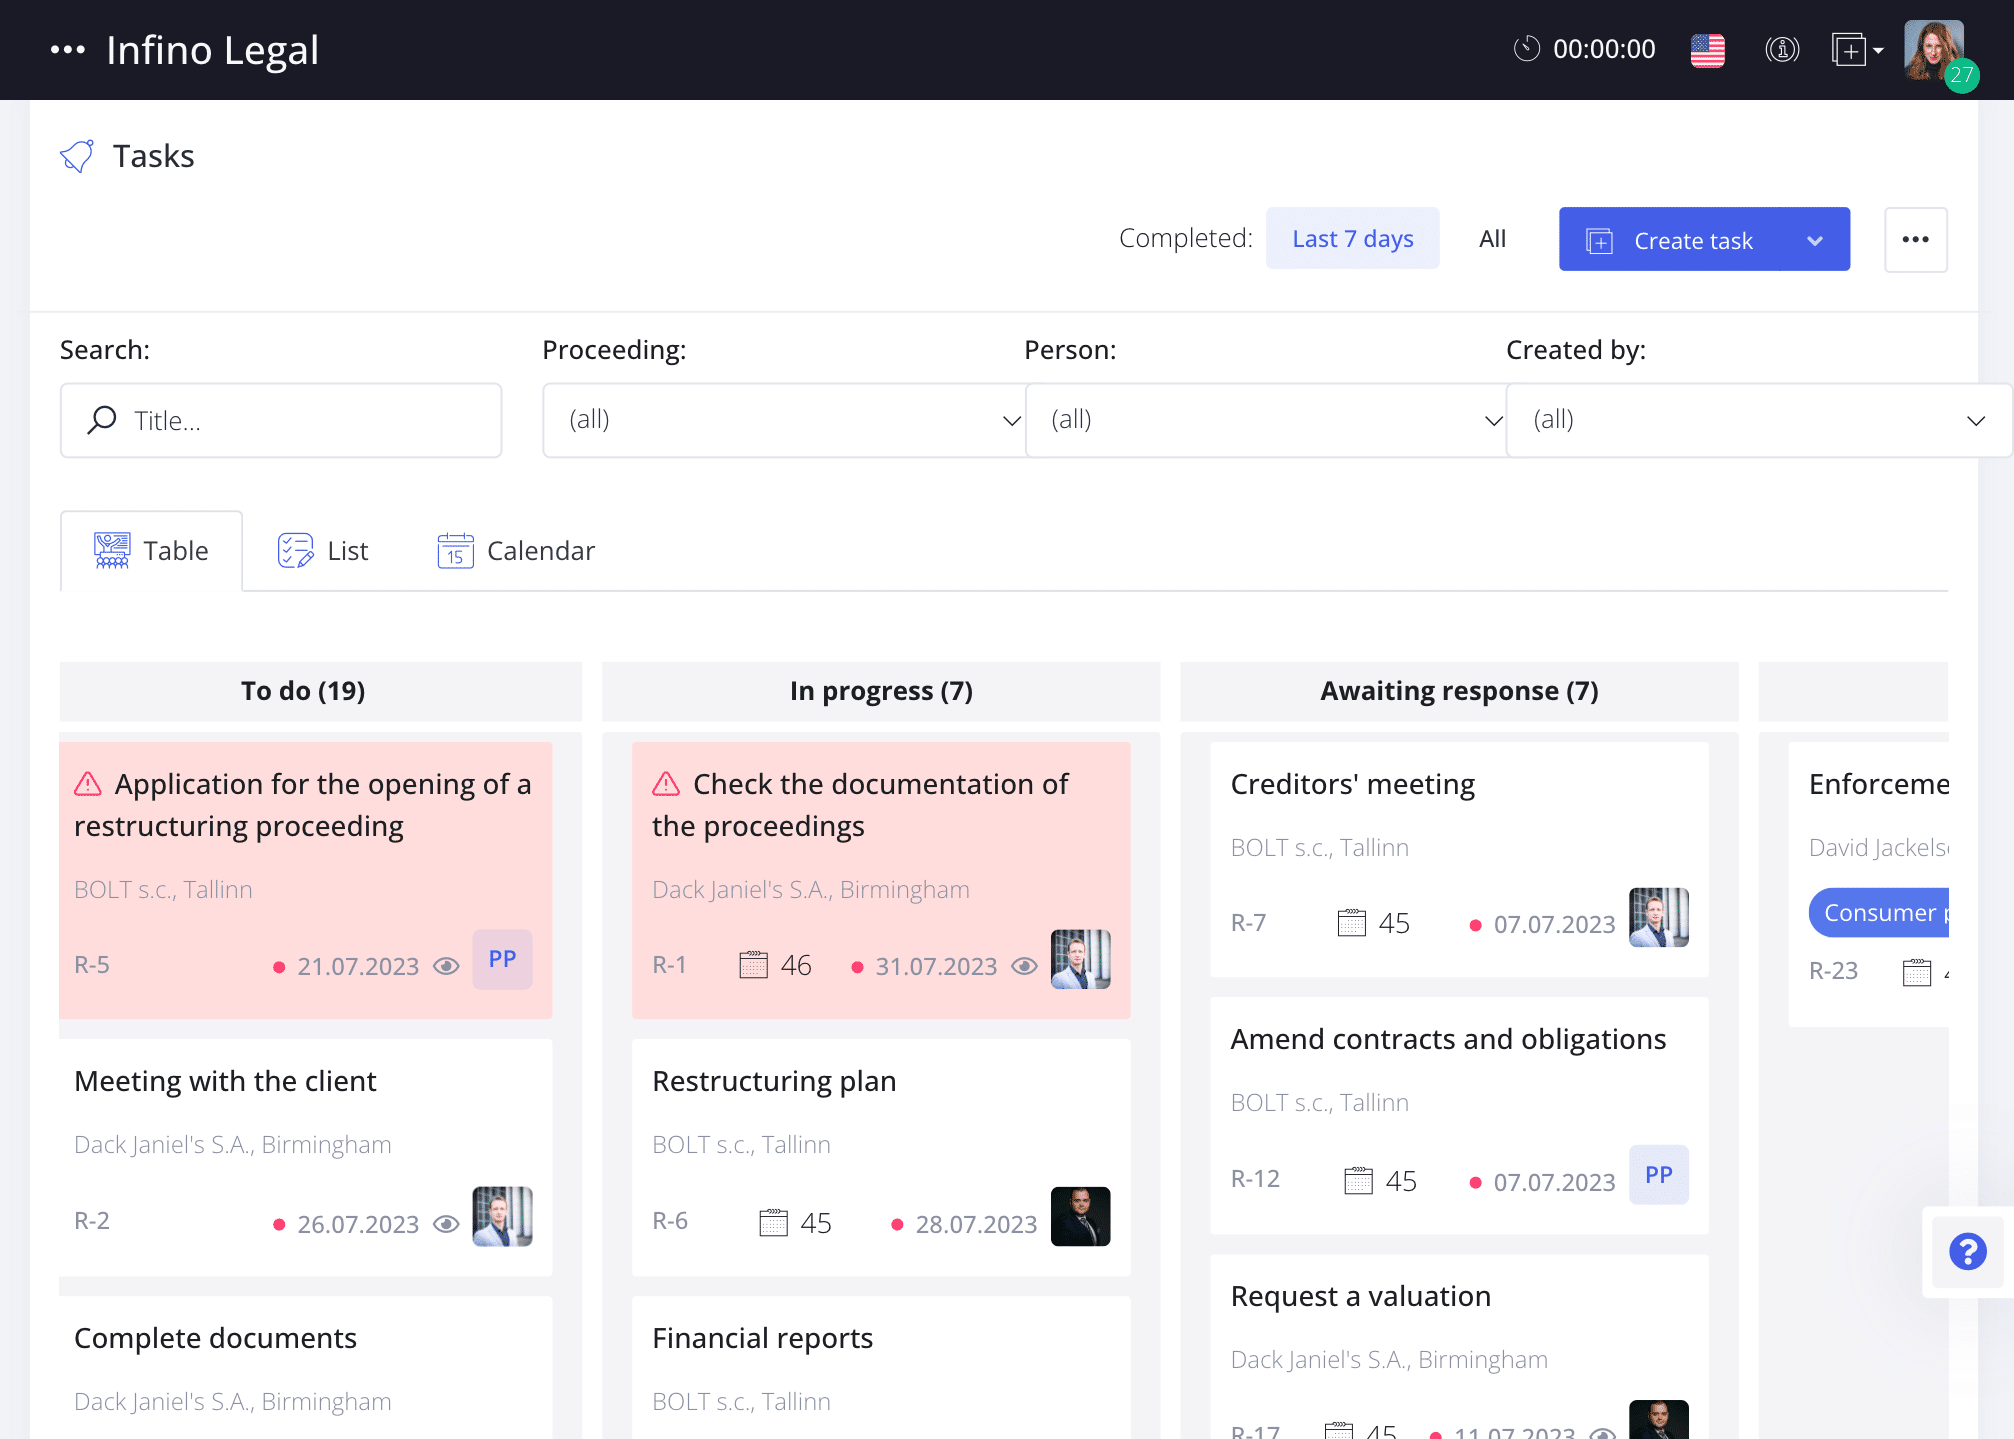
To work on the Kanban Board, you need to go to the Tasks tab from the main menu or from a specific case by selecting the Tasks subsection.
Column Configuration
To edit the board and its columns, press the edit button (three dots) and select the Configuration of fields tab.
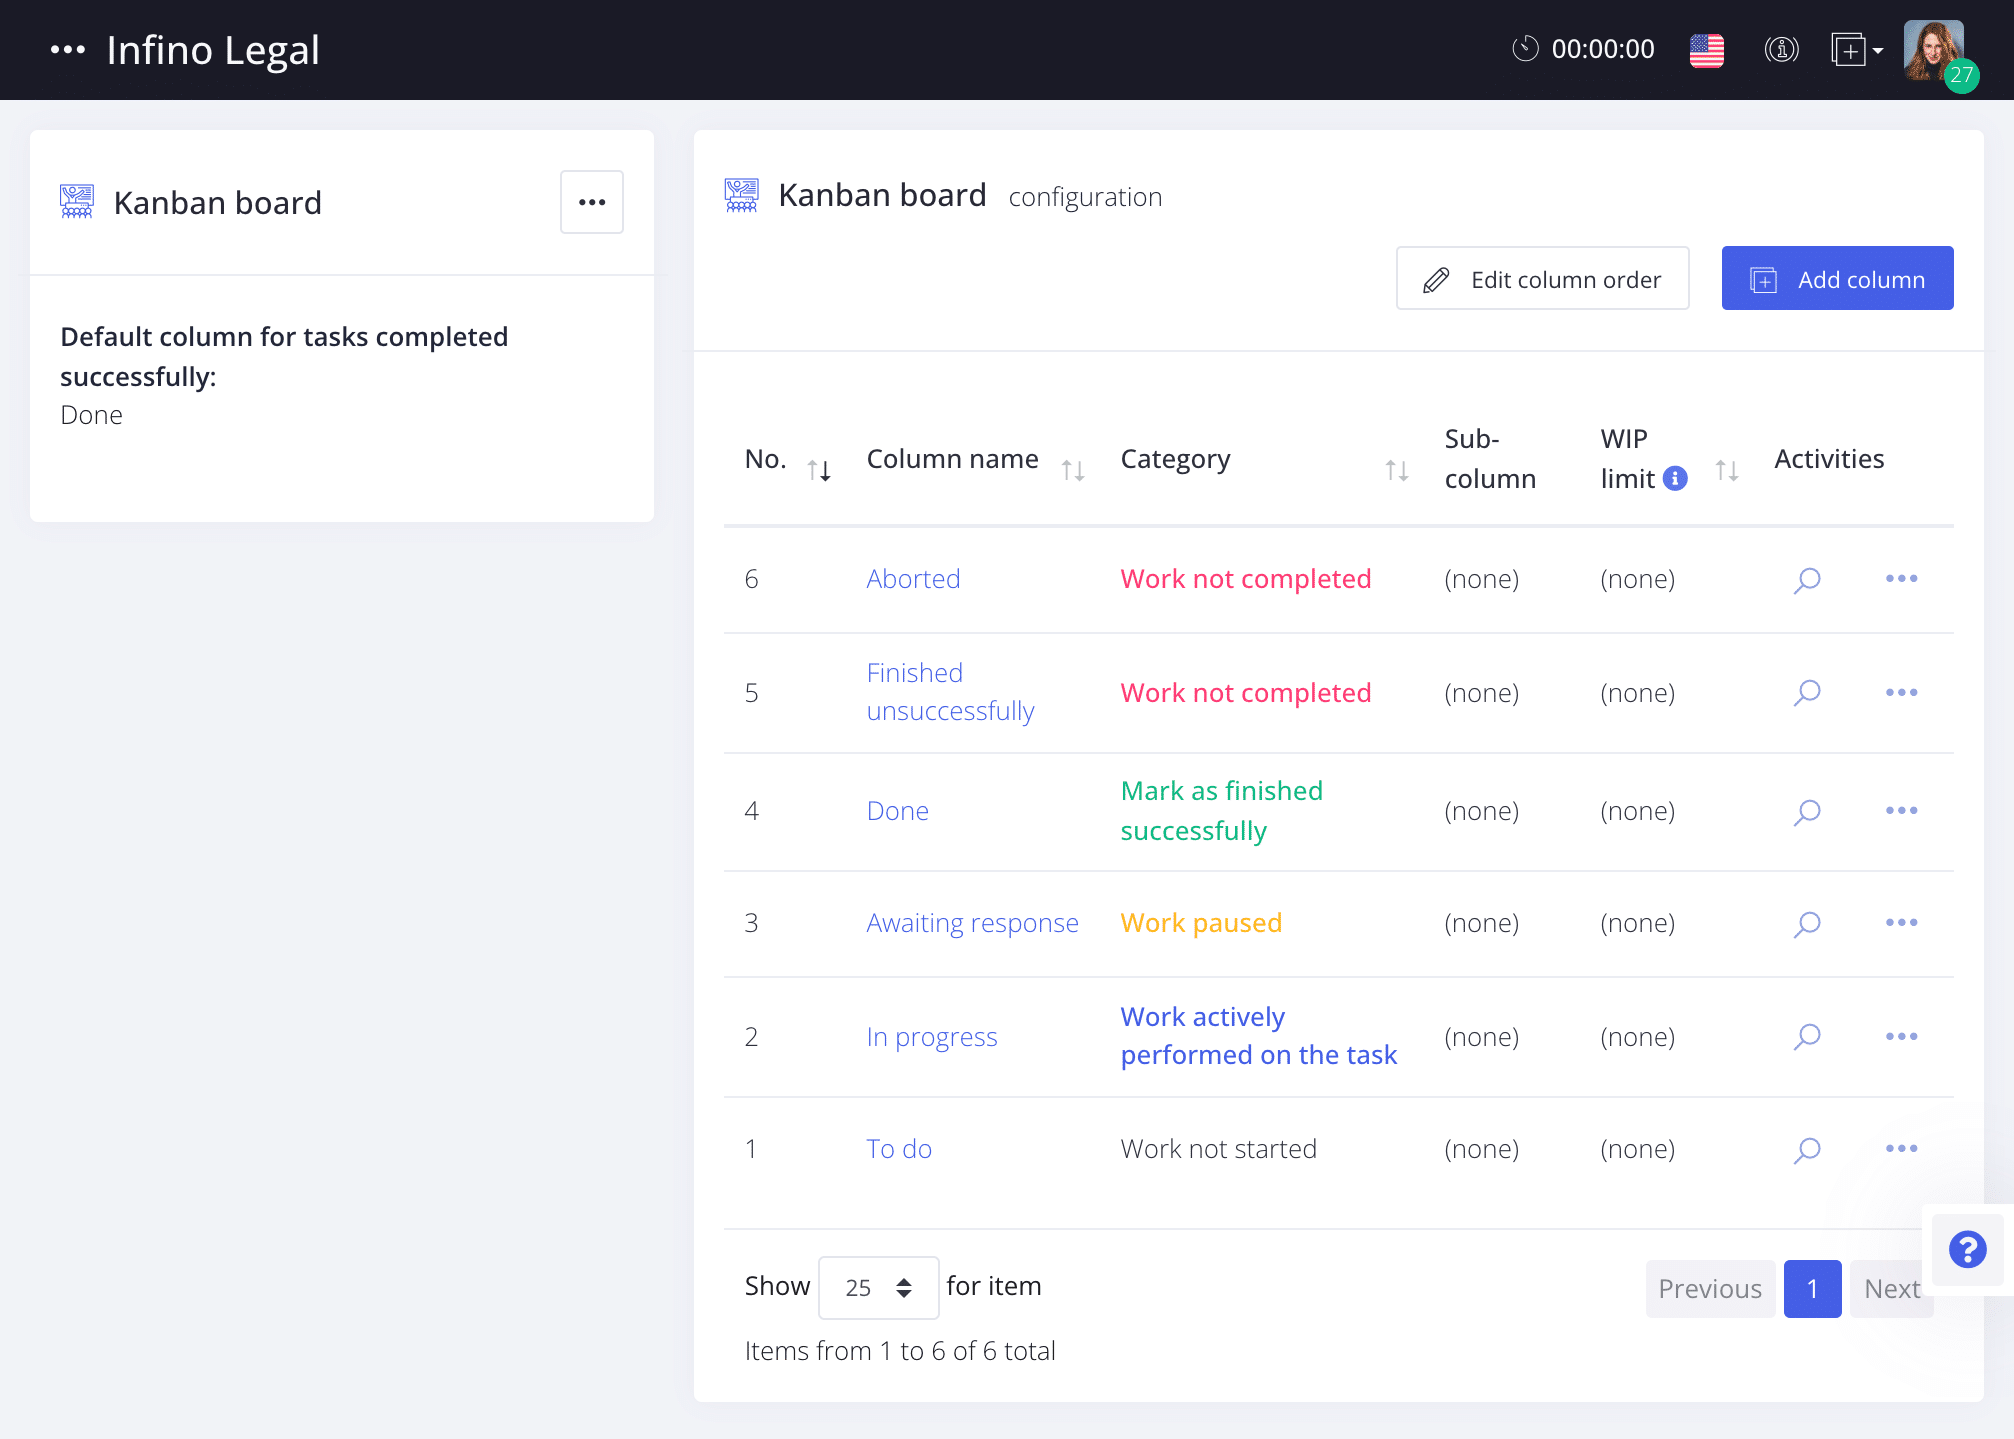
Clicking on the Configuration of fields tab will display a list of column names, categories, sub-columns, and WIP (Work in Progress) limits.
*WIP limit refers to the maximum number of tasks that can be in progress at the same time, helping the team avoid overload and indicating the workload at any given moment.
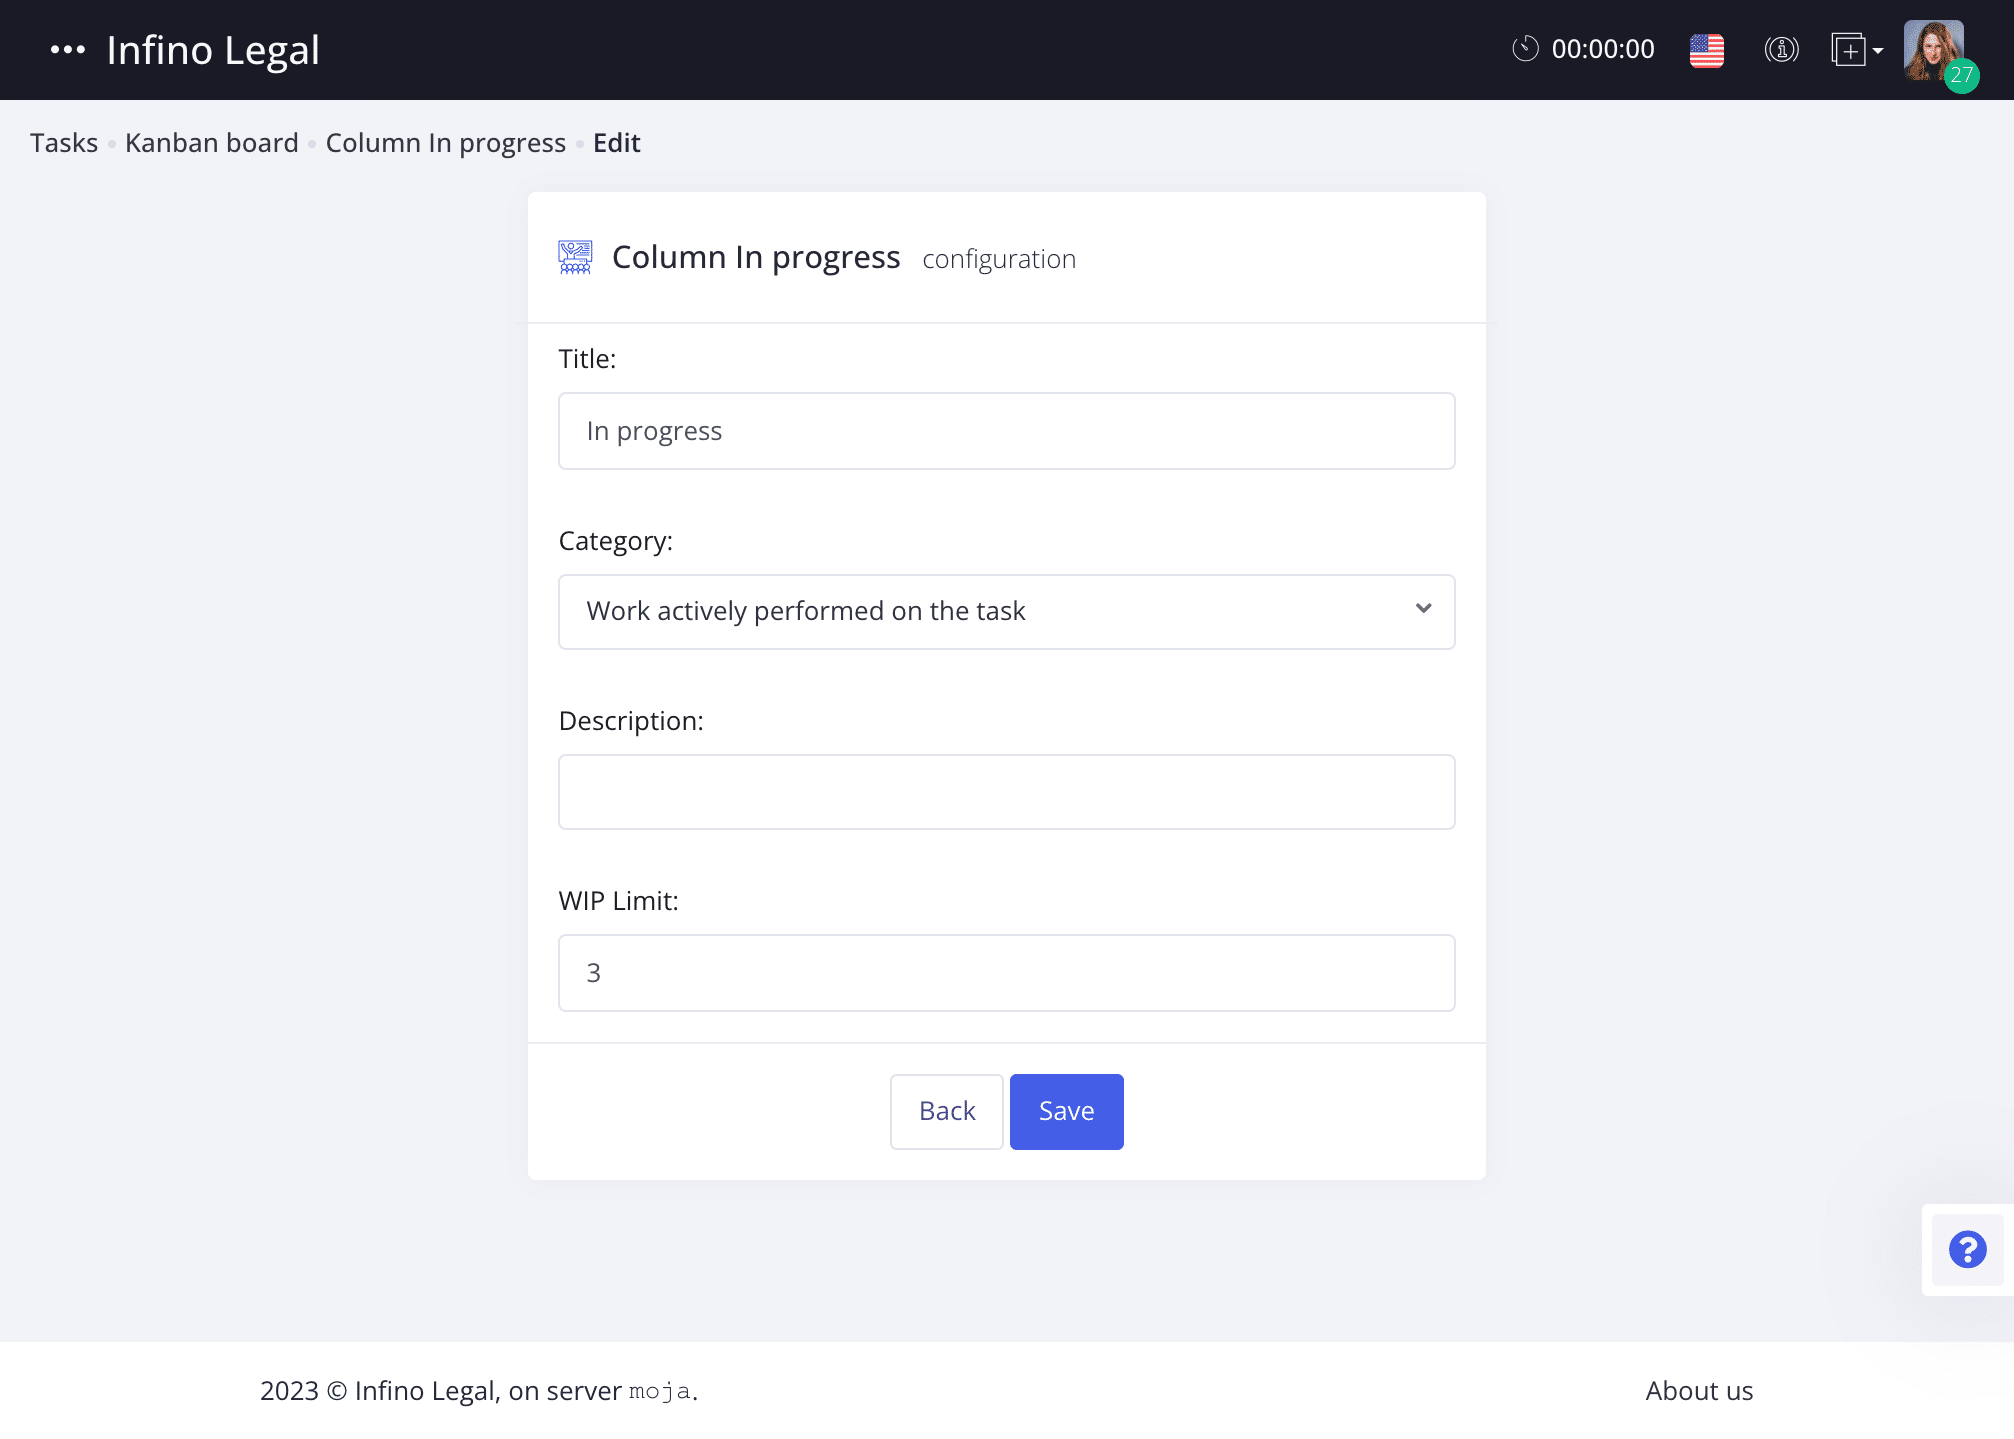
To edit a selected column, press the edit button with three dots and choose Edit, or Delete if you want to remove the column.
After entering the Edit button, you can change the column name, select a category, describe the column to facilitate the work of the office team, and add or modify the WIP limit.
To add a new column, click the blue Add column button.
Column Order
The system allows you to change the display order of the columns on the board. Simply click the Edit column order button.
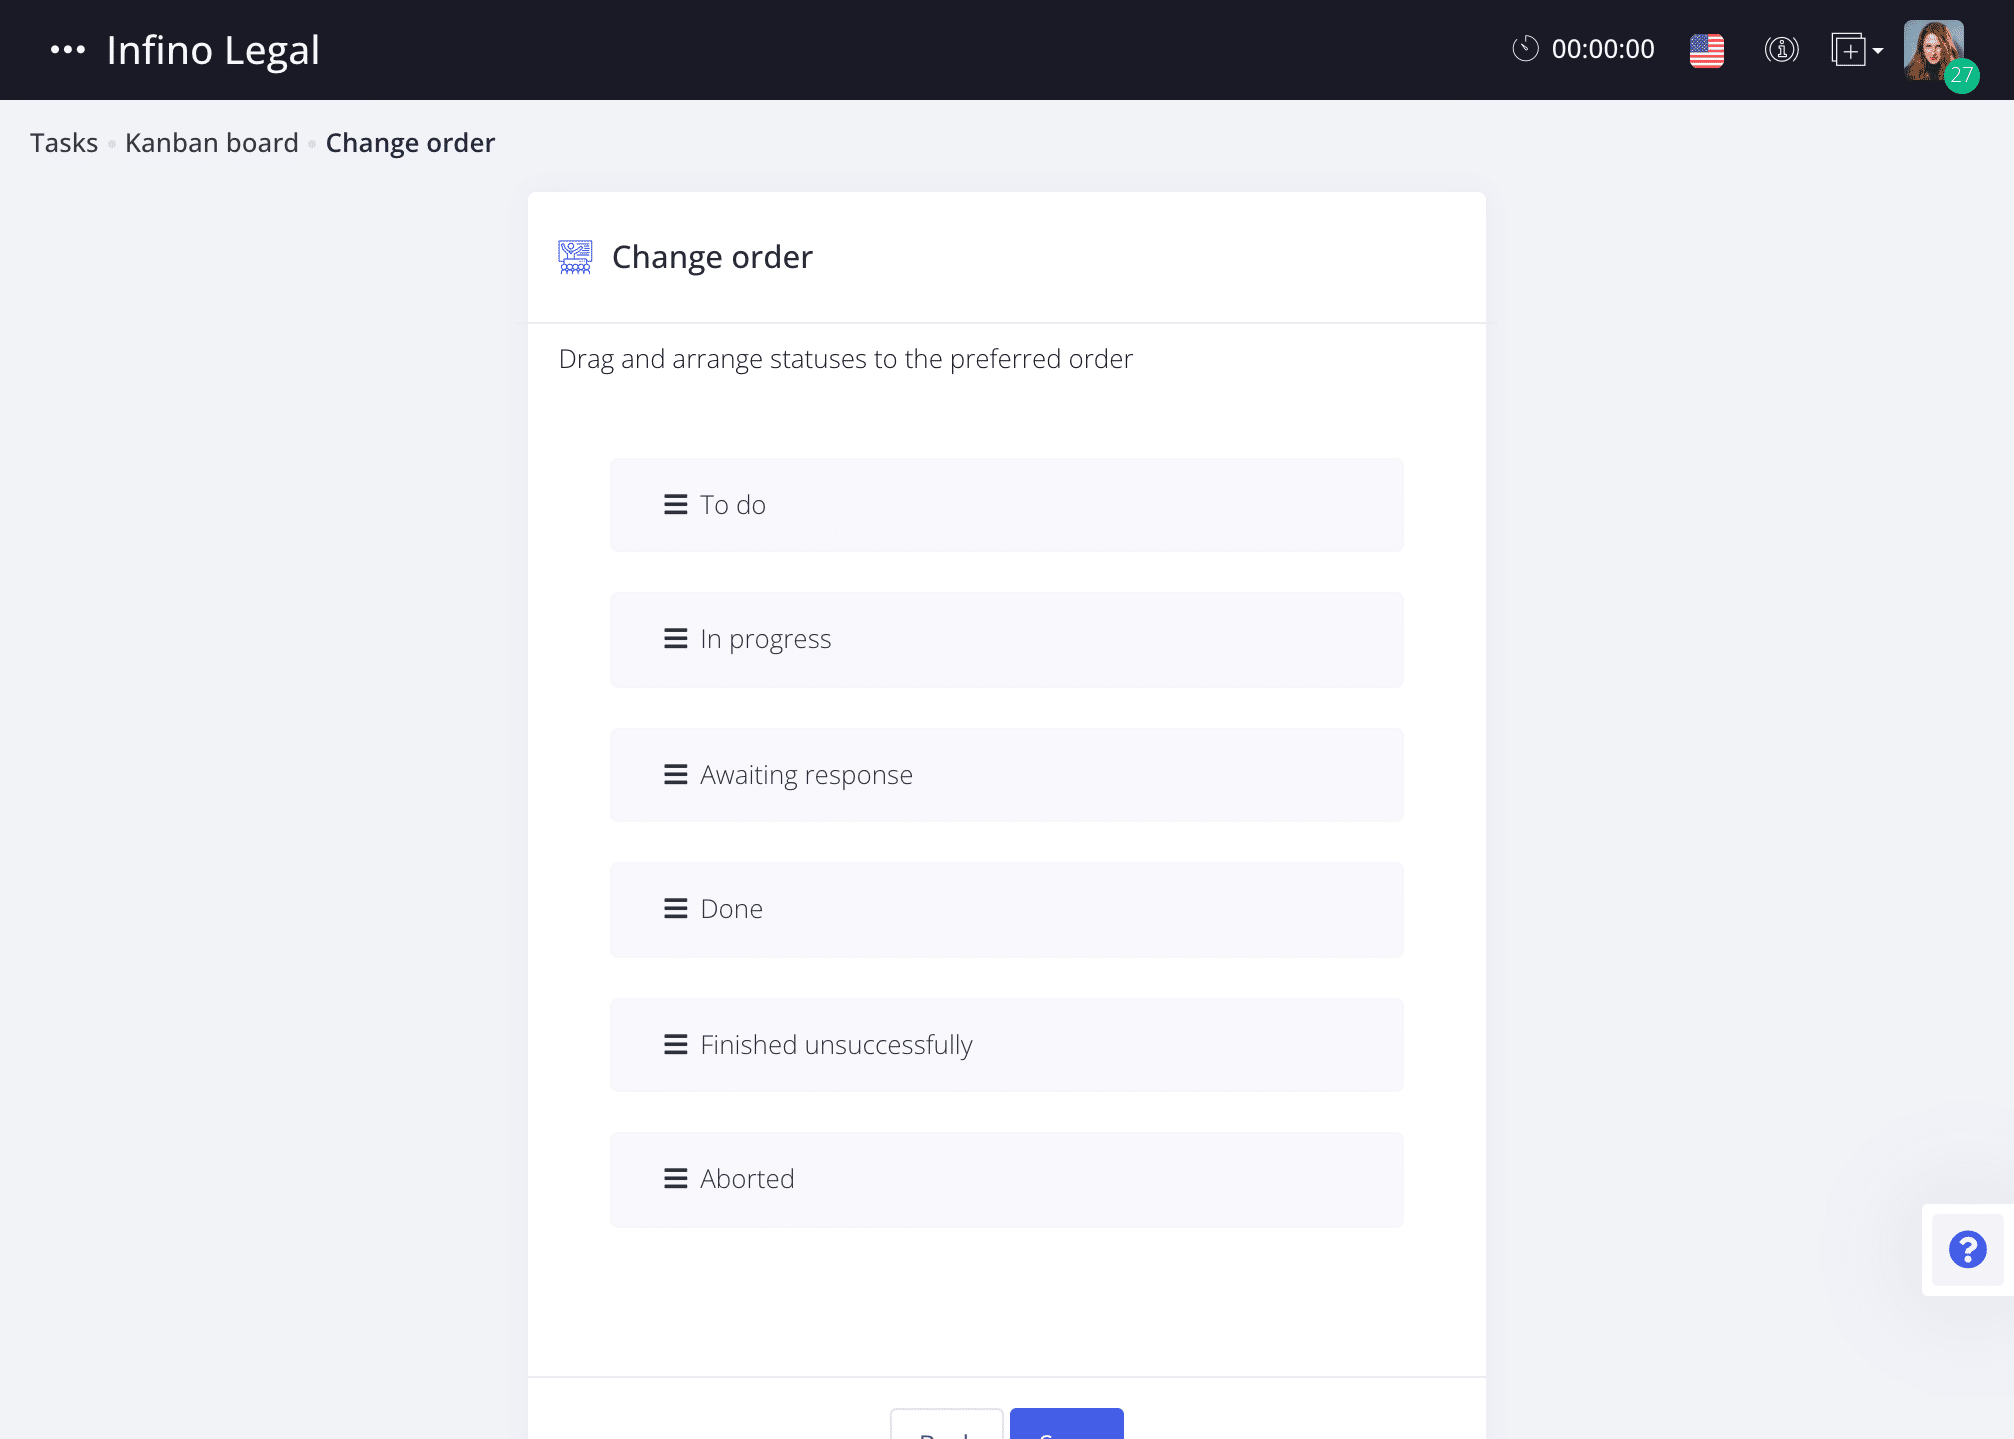
To change the column order, click on a specific column and move it up or down as needed. After setting the column names, click Save. If you don’t want to change the order, select Cancel.
Statistics
In the Tasks tab, we have added a subtab called Statistics. You can access it from the main menu on the left side, under Tasks -> Statistics, or from a specific case by selecting the Tasks section -> Edit button (three dots) -> Statistics.
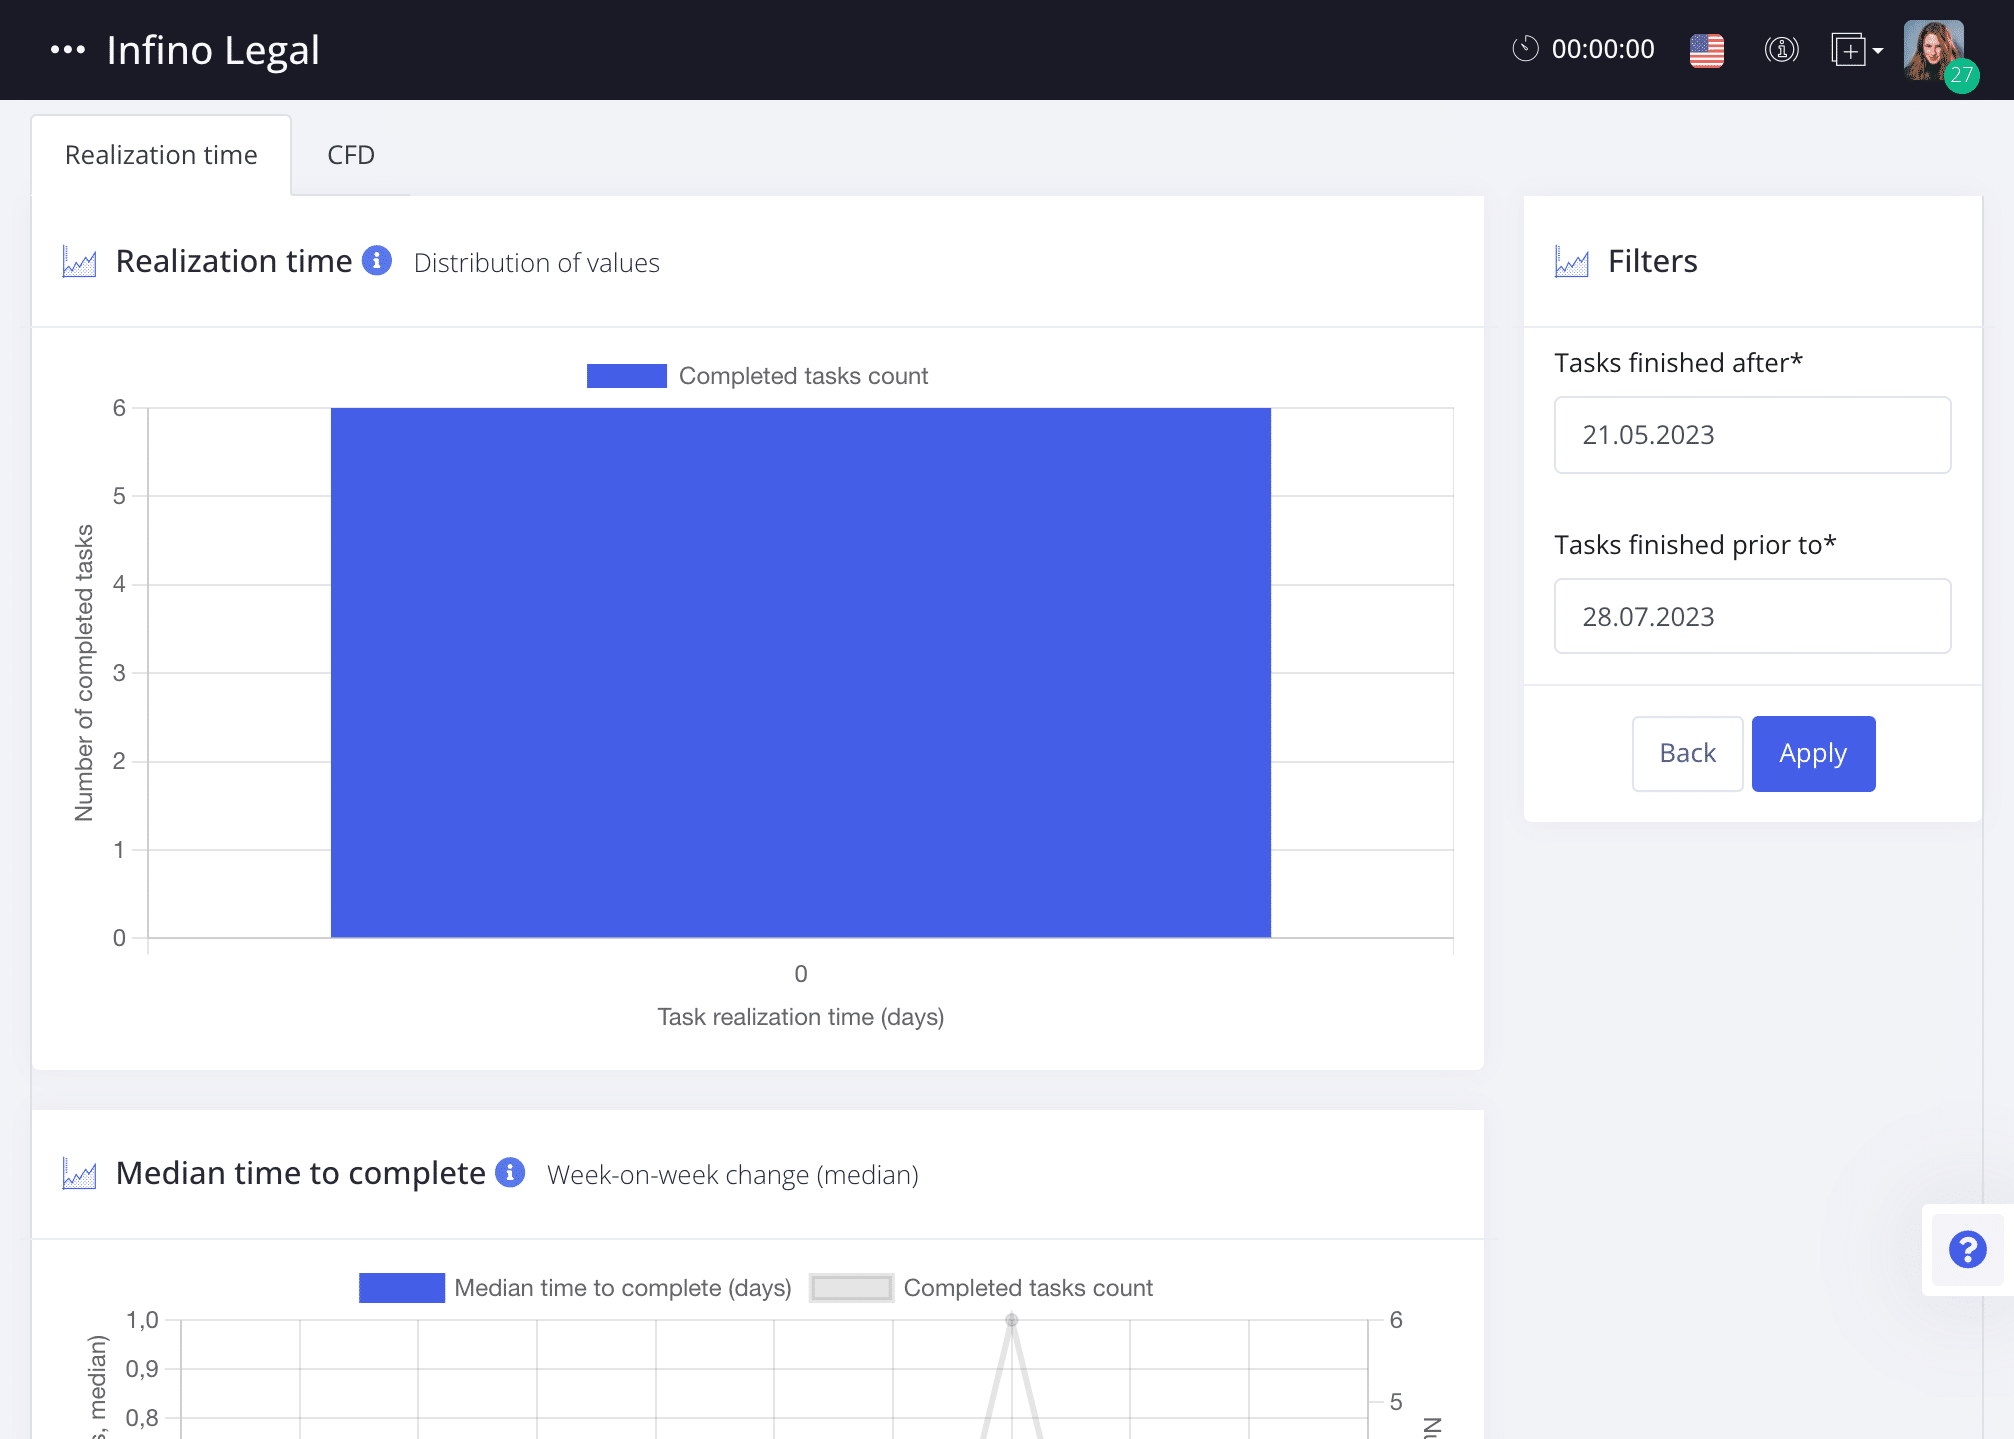
Lead Time Chart
The Lead Time Chart displays the time between starting work on a specific task and its delivery.
Average Lead Time Chart
This chart shows historical data on the duration of tasks undertaken by the team. It allows you to estimate the time needed to complete tasks in the future and effectively plan the overall process.
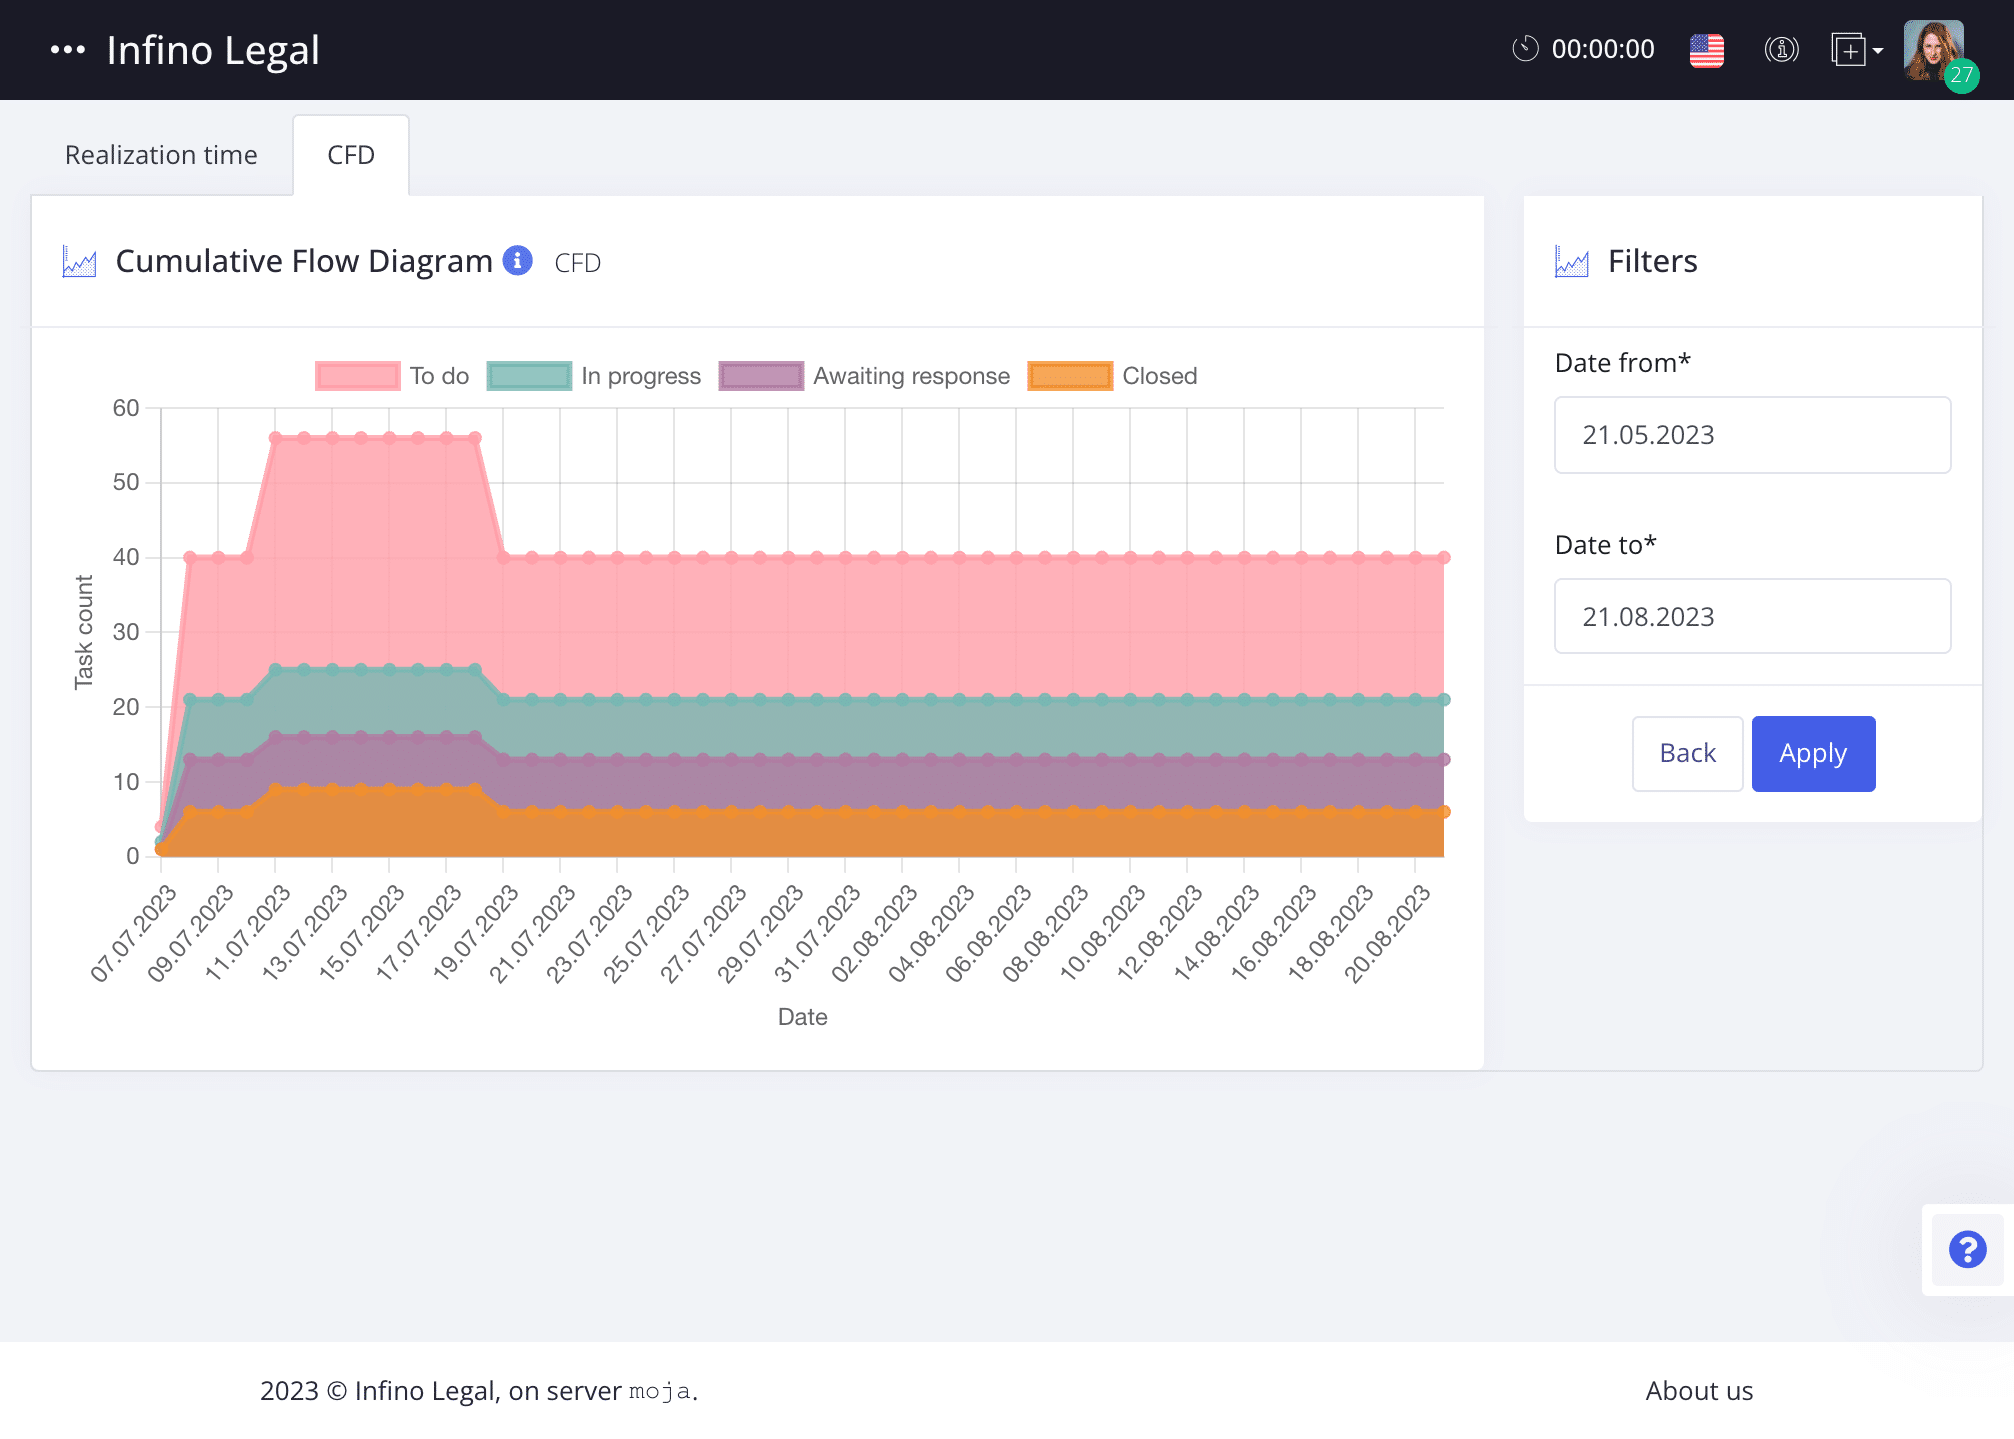
Cumulative Flow Diagram
The Cumulative Flow Diagram illustrates the entire process by showing the distribution of tasks in its various stages over a selected period of time.